IN THIS ARTICLE
Ask a creator how their account is doing and they will quote reach, followers and maybe saves. Those are the numbers Instagram puts on the first screen, and they are real. They are also a fraction of what you would need to make a good decision, and the app is quietly deleting the rest on a rolling basis while you make plans with what is left.
This is not a complaint about Instagram. Native Insights is a free dashboard attached to a free product, and several of its limits exist for privacy reasons that are entirely defensible. But if your income depends on the account, it is worth knowing precisely where the instrument stops reading, because the gaps sit exactly where the growth decisions are.
Gap one: it forgets, on a 90-day rolling basis
Instagram Insights retains roughly 90 days of profile and content performance. Stories data lasts longer, around two years, but the numbers you would use for planning, reach, engagement, audience activity, roll off after about a quarter.
The practical effect is that year-on-year comparison is impossible from inside the app. You cannot ask whether this November beat last November, whether your engagement rate has drifted since you changed format, or what your baseline looked like before a viral post reset your sense of normal. Every seasonal business, and food, travel, fitness and retail are all seasonal, is flying without the one comparison that matters most.
The manual workaround, and why it fails
The standard advice is to export monthly: screenshot key metrics, keep a spreadsheet of top posts, set a calendar reminder. It works exactly as long as you never miss one. Skip a month while you are busy, which is to say while the account is doing well, and there is a permanent hole in your record that no tool can retroactively fill. Instagram does not backfill what it has already dropped.
Gap two: there is no export
There is no raw data export from native Insights. You can look at the numbers, and you can screenshot them. You cannot pull a CSV, put three months side by side in a spreadsheet, or compute anything the app did not decide to compute for you. If you want to know your median rather than your total, or engagement per follower over time, or how a cohort of posts performed against another, you are hand-transcribing from a phone screen.
This is why the analytics tool market exists. Not because Instagram's numbers are wrong, but because they are read-only, temporary, and un-combinable with anything else you know about your business.
Gap three: it stops at the post
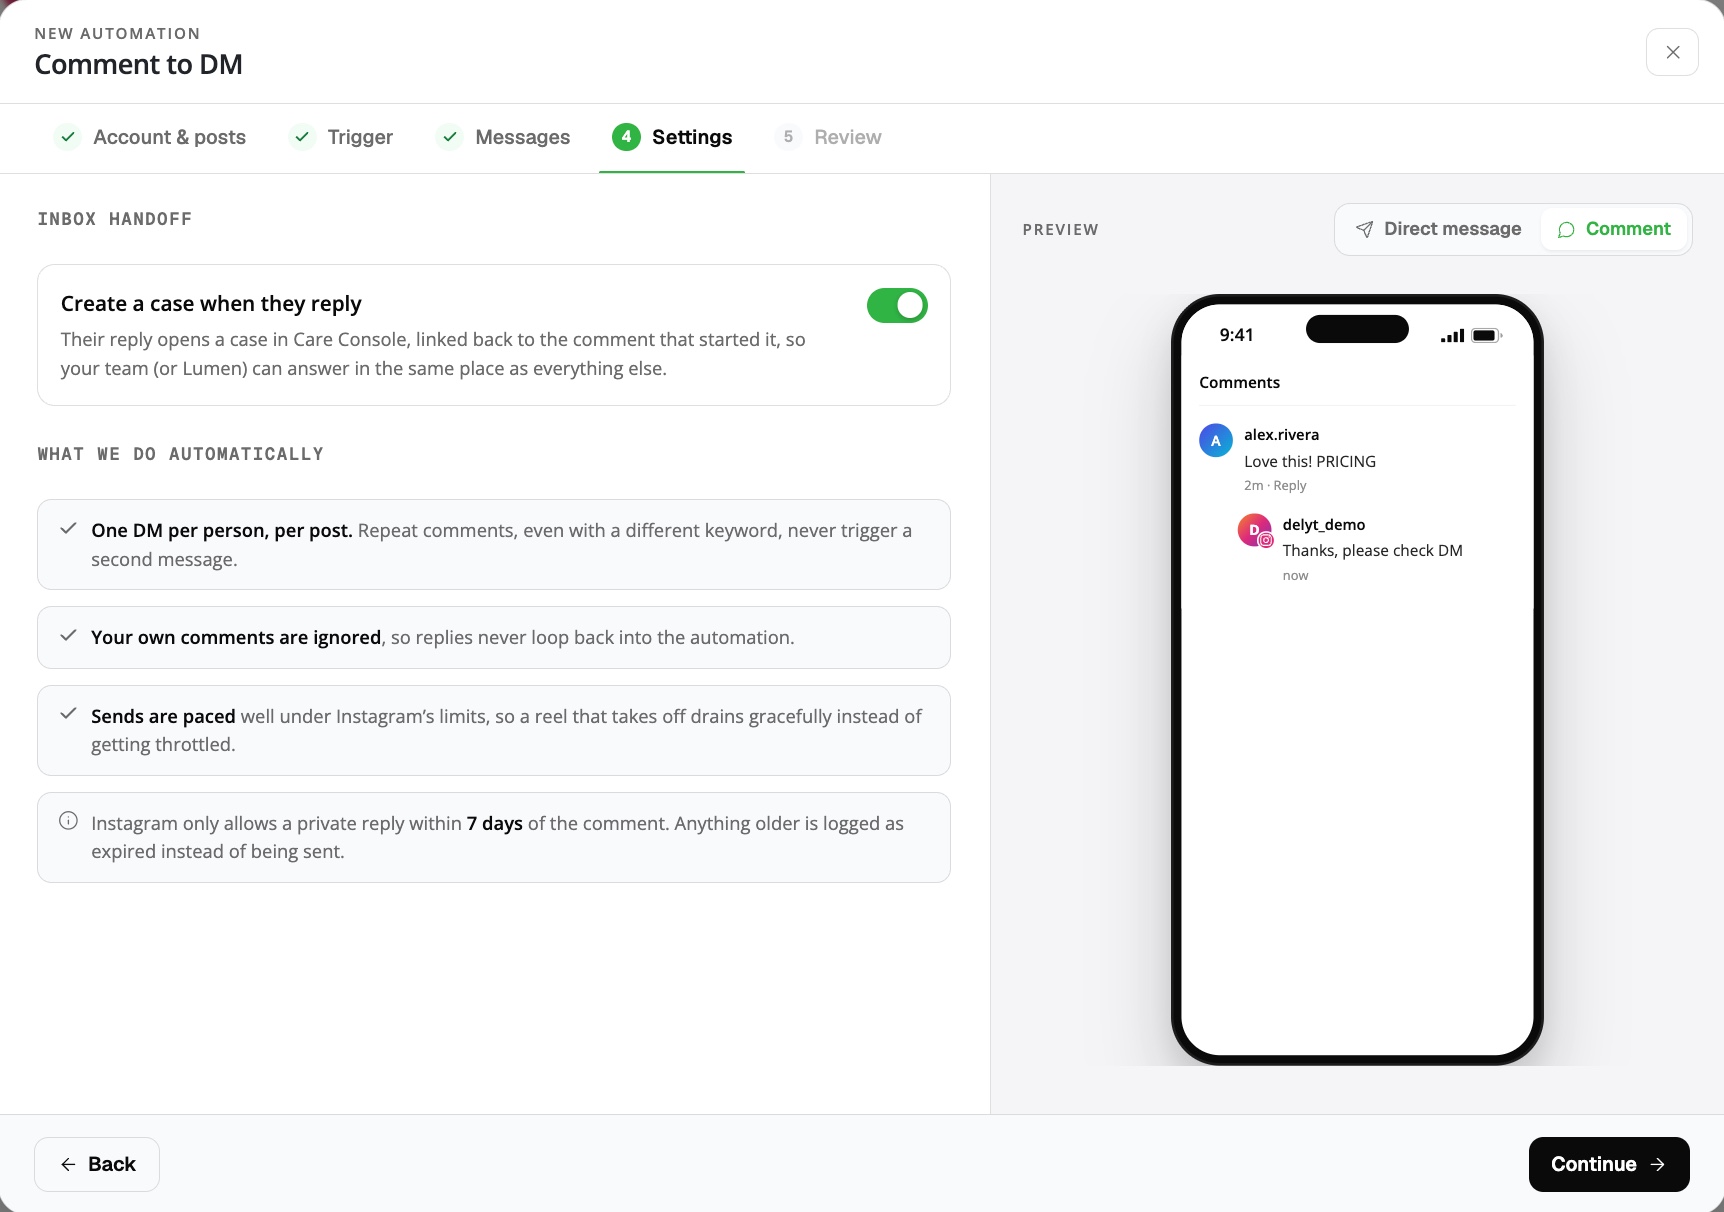
This is the big one for anyone running comment-to-DM, and it is the least discussed. Insights reports what happened to the post: reach, likes, comments, shares, saves. It reports nothing about what happened next. If your call to action is "comment RECIPE and I will DM it", Instagram tells you 1,800 people commented. It does not tell you:
- How many of those comments actually matched your keyword, rather than being "recipie", "recipe?" or a comment that simply mentioned the word.
- How many DMs were delivered as a result.
- How many people replied to that DM, which is the first real signal of intent.
- How many clicked the link inside it.
- Which keyword performed better when you tested two.
- What time of day the people who converted were actually active, as opposed to when your followers are online in aggregate.
Every one of those is a decision input. Reply rate in particular is the metric that separates a piece of content people wanted from a piece of content people scrolled past, and it is invisible from inside the app. You can have two reels with identical reach where one produced forty conversations and the other produced four, and native Insights will show you two similar-looking posts.
Gap four: shares are anonymous, and shares are the signal
Instagram shows share counts but not who shared. That is a deliberate privacy decision and the right one, since sharing happens in DMs, close friends lists and private accounts. But it does mean the single strongest indicator of resonance, somebody caring enough to send your post to a specific person, arrives as a number with no texture. You know the post was shared 900 times. You cannot learn anything about the 900.
There is no tool that fixes this, ours included, and anyone claiming otherwise is either scraping or guessing. It is worth naming as a permanent limit rather than a gap someone will close.
What a complete picture looks like
The gaps break into two categories, and only one is solvable.
| What is missing | Why | Can it be recovered? |
|---|---|---|
| History beyond 90 days | Instagram retention policy | Yes, by recording continuously from today |
| Raw export | No native export function | Yes, through a platform that holds your own data |
| Keyword match rate | Insights stops at the post | Yes, the automation layer sees it |
| DM delivery, reply and click rate | Insights stops at the post | Yes, the automation layer sees it |
| Which keyword or format converts | Requires funnel data over time | Yes, once the above is recorded |
| Who shared your post | Privacy by design | No, and be wary of anyone who claims it |
The first five are recoverable for one reason: they are events happening in your own automations and your own inbox. If something is recording them as they happen, you own that history permanently, it is exportable, and it starts the day you switch it on. Which is the honest catch: none of it is retroactive. The best time to start recording was whenever your account started mattering to you.
Record the funnel Instagram will not
Delyt Social records comments matched, DMs delivered, replies and clicks under every automation, alongside publishing, from $9/mo. Your history, kept for as long as you keep the account.
See Delyt Social for creatorsThree questions worth being able to answer
- 1Which format produces conversations, not just views? Rank your last thirty posts by DMs generated rather than reach and the list will not be the one you expected.
- 2Which keyword actually gets typed? Run two on similar posts and compare match rate. Short and boring usually wins, and the gap is larger than people assume.
- 3What does a normal month look like for you? Not a viral month. The baseline is the number every growth decision is measured against, and it is precisely the number Instagram deletes.
None of this makes native Insights bad. Use it for what it is good at: reach, audience demographics, and a fast read on whether a post landed. Just do not build a strategy on an instrument that forgets a quarter at a time, cannot export, and stops measuring at the exact point where your audience becomes your business.
FREQUENTLY ASKED QUESTIONS